PROJECT : Handwritten Digits Classifier#
WORK IN PROGRESS
[208]:
import pandas as pd
from sklearn.datasets import load_digits
from sklearn.model_selection import train_test_split
from sklearn.svm import SVC
import matplotlib.pyplot as plt
import numpy as np
import matplotlib.image as mpimg
Loading Data#
internal data of sklearn digits
[2]:
digits = load_digits()
[3]:
digits.keys()
[3]:
dict_keys(['data', 'target', 'frame', 'feature_names', 'target_names', 'images', 'DESCR'])
[10]:
df = pd.DataFrame(digits.data, columns=digits.feature_names)
df['target'] = digits.target

df.head()
[10]:
| pixel_0_0 | pixel_0_1 | pixel_0_2 | pixel_0_3 | pixel_0_4 | pixel_0_5 | pixel_0_6 | pixel_0_7 | pixel_1_0 | pixel_1_1 | ... | pixel_6_7 | pixel_7_0 | pixel_7_1 | pixel_7_2 | pixel_7_3 | pixel_7_4 | pixel_7_5 | pixel_7_6 | pixel_7_7 | target | |
|---|---|---|---|---|---|---|---|---|---|---|---|---|---|---|---|---|---|---|---|---|---|
| 0 | 0.0 | 0.0 | 5.0 | 13.0 | 9.0 | 1.0 | 0.0 | 0.0 | 0.0 | 0.0 | ... | 0.0 | 0.0 | 0.0 | 6.0 | 13.0 | 10.0 | 0.0 | 0.0 | 0.0 | 0 |
| 1 | 0.0 | 0.0 | 0.0 | 12.0 | 13.0 | 5.0 | 0.0 | 0.0 | 0.0 | 0.0 | ... | 0.0 | 0.0 | 0.0 | 0.0 | 11.0 | 16.0 | 10.0 | 0.0 | 0.0 | 1 |
| 2 | 0.0 | 0.0 | 0.0 | 4.0 | 15.0 | 12.0 | 0.0 | 0.0 | 0.0 | 0.0 | ... | 0.0 | 0.0 | 0.0 | 0.0 | 3.0 | 11.0 | 16.0 | 9.0 | 0.0 | 2 |
| 3 | 0.0 | 0.0 | 7.0 | 15.0 | 13.0 | 1.0 | 0.0 | 0.0 | 0.0 | 8.0 | ... | 0.0 | 0.0 | 0.0 | 7.0 | 13.0 | 13.0 | 9.0 | 0.0 | 0.0 | 3 |
| 4 | 0.0 | 0.0 | 0.0 | 1.0 | 11.0 | 0.0 | 0.0 | 0.0 | 0.0 | 0.0 | ... | 0.0 | 0.0 | 0.0 | 0.0 | 2.0 | 16.0 | 4.0 | 0.0 | 0.0 | 4 |
5 rows × 65 columns
[105]:
test_digit = mpimg.imread('/opt/datasetsRepo/digits/4.png').mean(axis=2)
[29]:
df.target.value_counts()
[29]:
3    183
5    182
1    182
6    181
4    181
9    180
7    179
0    178
2    177
8    174
Name: target, dtype: int64
Visualize Digits#
[23]:
plt.imshow(df[df.target == 1][[i for i in df.columns if 'pixel' in i]].iloc[0].values.reshape(8,8), cmap='gray')
[23]:
<matplotlib.image.AxesImage at 0x7f692be81b80>
[24]:
plt.imshow(df[df.target == 0][[i for i in df.columns if 'pixel' in i]].iloc[0].values.reshape(8,8), cmap='gray')
[24]:
<matplotlib.image.AxesImage at 0x7f692bdf17f0>

[25]:
plt.imshow(df[df.target == 4][[i for i in df.columns if 'pixel' in i]
                              ].iloc[0].values.reshape(8, 8), cmap='gray')
[25]:
<matplotlib.image.AxesImage at 0x7f692bd623d0>

Dataset preparation#
[162]:
x_train, x_test, y_train, y_test = train_test_split(df[[i for i in df.columns if 'pixel' in i]], df.target, \
    random_state=30, test_size=0.1, stratify=df.target)
Support Vector Machine Model Building#
[173]:
svc_model = SVC(kernel='rbf')
svc_model.fit(x_train, y_train)
[173]:
SVC()
training accuracy#
[174]:
svc_model.score(x_train, y_train)
[174]:
0.9962894248608535
testing accuracy#
[175]:
svc_model.score(x_test, y_test)
[175]:
0.9944444444444445
classification report#
[176]:
from sklearn.metrics import classification_report, plot_confusion_matrix
[177]:
print(classification_report(y_test, svc_model.predict(x_test)))
              precision    recall  f1-score   support

           0       1.00      1.00      1.00        18
           1       1.00      1.00      1.00        18
           2       1.00      1.00      1.00        18
           3       1.00      1.00      1.00        18
           4       1.00      1.00      1.00        18
           5       1.00      1.00      1.00        18
           6       1.00      1.00      1.00        18
           7       0.95      1.00      0.97        18
           8       1.00      1.00      1.00        18
           9       1.00      0.94      0.97        18

    accuracy                           0.99       180
   macro avg       0.99      0.99      0.99       180
weighted avg       0.99      0.99      0.99       180
[178]:
plot_confusion_matrix(svc_model, x_test, y_test)
[178]:
<sklearn.metrics._plot.confusion_matrix.ConfusionMatrixDisplay at 0x7f692a4c9580>

Test with real image#
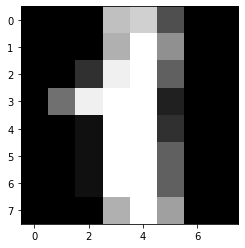
[179]:
plt.imshow(test_digit, cmap='gray')
[179]:
<matplotlib.image.AxesImage at 0x7f692a297580>

[180]:
svc_model.predict(test_digit.reshape(1,64), )
[180]:
array([4])