Weight of Evidence & Information Value#
References
https://documentation.sas.com/doc/en/vdmmlcdc/8.1/casstat/viyastat_binning_details02.htm
https://www.listendata.com/2015/03/weight-of-evidence-woe-and-information.html
Weight of evidence
Generally measure of separation
measure how much evidence supports or undermines the hypothesis
The information value (IV) is a weighted sum of the WOE of the characteristic’s attributes. The weight is the difference between the conditional probability of an attribute for an event and the conditional probability of that attribute for a nonevent.
\begin{align*} \text{Weight of Evidence} &= \ln{(\frac{\text{% of non-event}}{\text{% of event}})} = \ln{\frac{\text{% of y = 0}}{\text{% of y = 1}}}\\ \\ \text{Information Value} &= \sum{(\text{% of non-event} - \text{% of event})} * \text{WOE} \end{align*}
Information Value |
Variable Predictiveness |
|---|---|
Less than 0.02 |
Not useful for prediction |
0.02 to 0.1 |
Weak predictive Power |
0.1 to 0.3 |
Medium predictive Power |
0.3 to 0.5 |
Strong predictive Power |
>0.5 |
Suspicious Predictive Power |
[1]:
from sklearn.datasets import load_breast_cancer
from mightypy.stats import WOE_IV
import pandas as pd

import matplotlib.pyplot as plt
[2]:
dataset = load_breast_cancer(as_frame=True)

df = dataset.frame
df.head(3)
[2]:
| mean radius | mean texture | mean perimeter | mean area | mean smoothness | mean compactness | mean concavity | mean concave points | mean symmetry | mean fractal dimension | ... | worst texture | worst perimeter | worst area | worst smoothness | worst compactness | worst concavity | worst concave points | worst symmetry | worst fractal dimension | target | |
|---|---|---|---|---|---|---|---|---|---|---|---|---|---|---|---|---|---|---|---|---|---|
| 0 | 17.99 | 10.38 | 122.8 | 1001.0 | 0.11840 | 0.27760 | 0.3001 | 0.14710 | 0.2419 | 0.07871 | ... | 17.33 | 184.6 | 2019.0 | 0.1622 | 0.6656 | 0.7119 | 0.2654 | 0.4601 | 0.11890 | 0 |
| 1 | 20.57 | 17.77 | 132.9 | 1326.0 | 0.08474 | 0.07864 | 0.0869 | 0.07017 | 0.1812 | 0.05667 | ... | 23.41 | 158.8 | 1956.0 | 0.1238 | 0.1866 | 0.2416 | 0.1860 | 0.2750 | 0.08902 | 0 |
| 2 | 19.69 | 21.25 | 130.0 | 1203.0 | 0.10960 | 0.15990 | 0.1974 | 0.12790 | 0.2069 | 0.05999 | ... | 25.53 | 152.5 | 1709.0 | 0.1444 | 0.4245 | 0.4504 | 0.2430 | 0.3613 | 0.08758 | 0 |
3 rows × 31 columns
[3]:
target_map = {0: 'False', 1: 'True'}

df.insert(loc=df.shape[1], column='label', value=df['target'].map(target_map))
[9]:
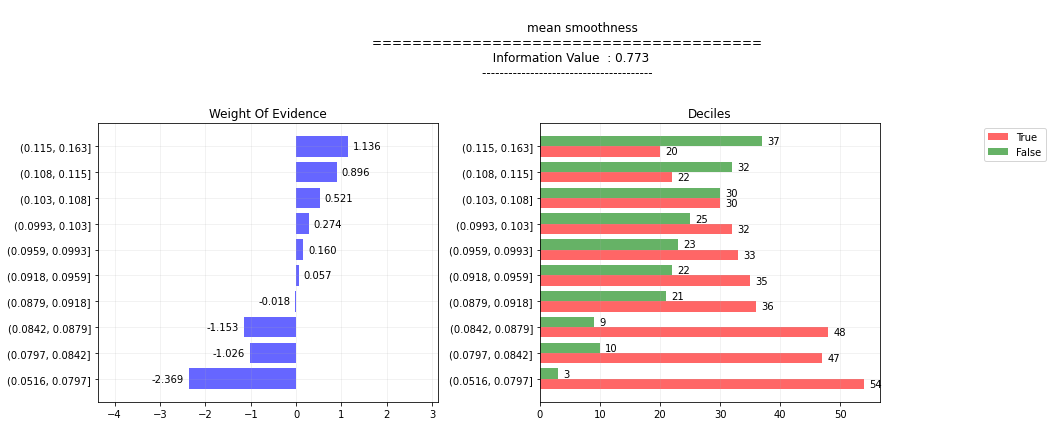
woe_iv_obj = WOE_IV(event='True', non_event='False', target_col='label',bucket_col='mean smoothness')
[10]:
woe, iv = woe_iv_obj.values(df)
[11]:
woe
[11]:
| label | False | True | adj_event | adj_non_event | %_event_True | %_non_event_False | woe | iv |
|---|---|---|---|---|---|---|---|---|
| buckets_mean smoothness | ||||||||
| (0.0516, 0.0797] | 3 | 54 | 54 | 3 | 0.151261 | 0.014151 | -2.369222 | 0.324843 |
| (0.0797, 0.0842] | 10 | 47 | 47 | 10 | 0.131653 | 0.047170 | -1.026413 | 0.086714 |
| (0.0842, 0.0879] | 9 | 48 | 48 | 9 | 0.134454 | 0.042453 | -1.152827 | 0.106061 |
| (0.0879, 0.0918] | 21 | 36 | 36 | 21 | 0.100840 | 0.099057 | -0.017847 | 0.000032 |
| (0.0918, 0.0959] | 22 | 35 | 35 | 22 | 0.098039 | 0.103774 | 0.056844 | 0.000326 |
| (0.0959, 0.0993] | 23 | 33 | 33 | 23 | 0.092437 | 0.108491 | 0.160136 | 0.002571 |
| (0.0993, 0.103] | 25 | 32 | 32 | 25 | 0.089636 | 0.117925 | 0.274289 | 0.007759 |
| (0.103, 0.108] | 30 | 30 | 30 | 30 | 0.084034 | 0.141509 | 0.521150 | 0.029953 |
| (0.108, 0.115] | 32 | 22 | 22 | 32 | 0.061625 | 0.150943 | 0.895843 | 0.080016 |
| (0.115, 0.163] | 37 | 20 | 20 | 37 | 0.056022 | 0.174528 | 1.136335 | 0.134662 |
[12]:
iv
[12]:
0.7729378109850594
[13]:
fig = woe_iv_obj.plot(figsize=(15,6))
fig.tight_layout();