Image Segmentation#
WORK IN PROGRESS
[2]:
import numpy as np
import matplotlib.pyplot as plt
import matplotlib.image as mpimg
import cv2
[3]:
from sklearn.cluster import KMeans
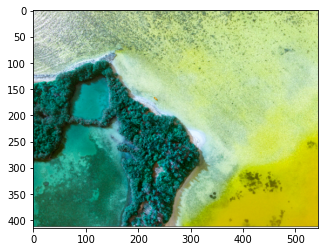
Loading Image#
[6]:
img = mpimg.imread('./images/sea_shore.png')
[7]:
plt.imshow(img)
[7]:
<matplotlib.image.AxesImage at 0x7f7e8287dc40>
[19]:
x,y,z = img.shape

print(f"""
height : {x}
width  : {y}
layers : {z}
""")
height : 415
width  : 543
layers : 4
lets take only 3 layers
[20]:
img = img[...,:3]
[21]:
x,y,z = img.shape

print(f"""
height : {x}
width  : {y}
layers : {z}
""")
height : 415
width  : 543
layers : 3
Flattening#
              layer3 ___________________
                    |x3                 |
         layer2 ____|______________     |
               |x2                 |    |
     layer1 ___|______________     |    |
           |x1                |    |    |
           |                  |    |    |
           |                  |    |    |
   height  |                  |    |    |
           |                  |    |    |
           |                  |    |____|
           |                  |    |
           |                  |____|
           |                  |
           |__________________|

                  width


                       Layers
                _____________________
               | x1      x2       x3 |
               |                     |
               |                     |
               |                     |
height * width |                     |
               |                     |
               |                     |
               |        ...          |
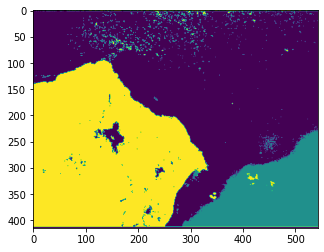
[22]:
flatten = img.reshape(x*y,z)
[28]:
flatten.shape
[28]:
(225345, 3)
[29]:
model = KMeans(n_clusters=3)
[30]:
clustered = model.fit_predict(flatten)
[31]:
clustered_frame = clustered.reshape(x,y)
clustered_frame.shape
[31]:
(415, 543)
[32]:
plt.imshow(clustered_frame)
[32]:
<matplotlib.image.AxesImage at 0x7f7e719d5d30>
Convert to gray scale#
[33]:
gray_img = img.mean(axis=-1)
gray_img.shape
[33]:
(415, 543)
[34]:
plt.imshow(gray_img,cmap='gray')
[34]:
<matplotlib.image.AxesImage at 0x7f7e723d4c70>

Gaussian smoothing#
https://homepages.inf.ed.ac.uk/rbf/HIPR2/gsmooth.htm
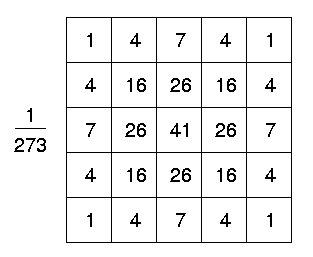
[50]:
from scipy import signal

gaussian_smoothing = np.array([
    [1, 4, 7, 4, 1],
    [4, 16, 26, 16, 4],
    [7, 26, 41, 26, 7],
    [4, 16, 26, 16, 4],
    [1, 4, 7, 4, 1]
])/ 273


edge_frame = signal.convolve2d(img.mean(axis=-1),gaussian_smoothing,mode='same')
[51]:
edge_frame.shape
[51]:
(415, 543)
[52]:
plt.imshow(edge_frame,cmap='gray')
[52]:
<matplotlib.image.AxesImage at 0x7f26f7f2eaf0>
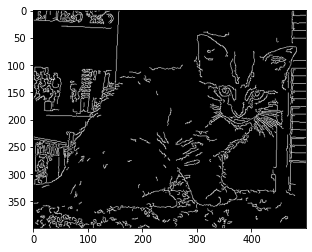
OpenCV Canny Edge Detection#
https://en.wikipedia.org/wiki/Canny_edge_detector
[50]:
img = cv2.imread('./images/cat.jpg',0)
[61]:
edge = cv2.Canny(img,50,100)
plt.imshow(edge,cmap = 'gray')
[61]:
<matplotlib.image.AxesImage at 0x7f7e5f171580>