Trend, Slope & Regression#
[1]:
import numpy as np
from mightypy.ml import polynomial_regression, trend
import matplotlib.pyplot as plt
Trend#
[2]:
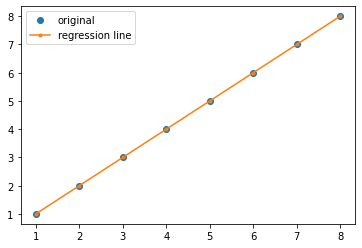
x = np.array([1, 2, 3, 4, 5, 6, 7, 8])
y = np.array([1, 2, 3, 4, 5, 6, 7, 8])
s, r, l = trend(x, y)
plt.plot(x, y, 'o', label='original')
plt.plot(x, l, '.-',  label='regression line')
plt.legend();
[3]:
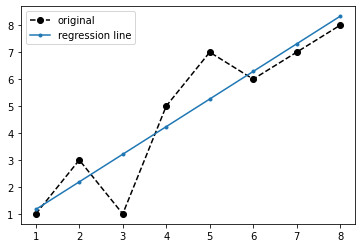
x = np.array([1, 2, 3, 4, 5, 6, 7, 8])
y = np.array([1, 3, 1, 5, 7, 6, 7, 8])
s, r, l = trend(x, y)

plt.plot(x, y,'ko--', label='original')
plt.plot(x, l,'.-',  label='regression line')
plt.legend();
polynomial regression#
[4]:
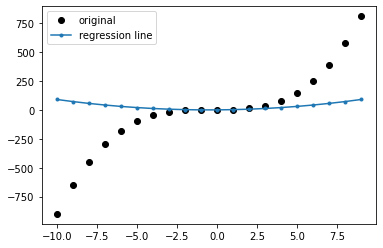
x = np.arange(-10, 10)
y = x**2 + x**3
s, r, l = polynomial_regression(x, y, 3)

plt.plot(x, y, 'ko', label='original')
plt.plot(x, l, '.-',  label='regression line')
plt.legend();
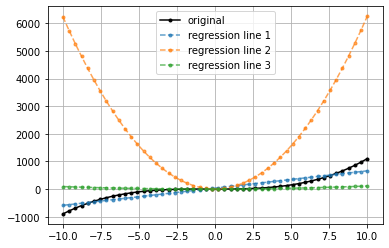
[5]:
x = np.linspace(-10,10,50)
y = x**3 + x**2 + 1

plt.plot(x, y, 'k.-', label='original')
for i in range(1,4):
    s, r, l = polynomial_regression(x, y, i)
    plt.plot(x, l, '.--',  label='regression line '+ str(i), alpha=0.7)
    plt.legend()

plt.grid()
plt.show()